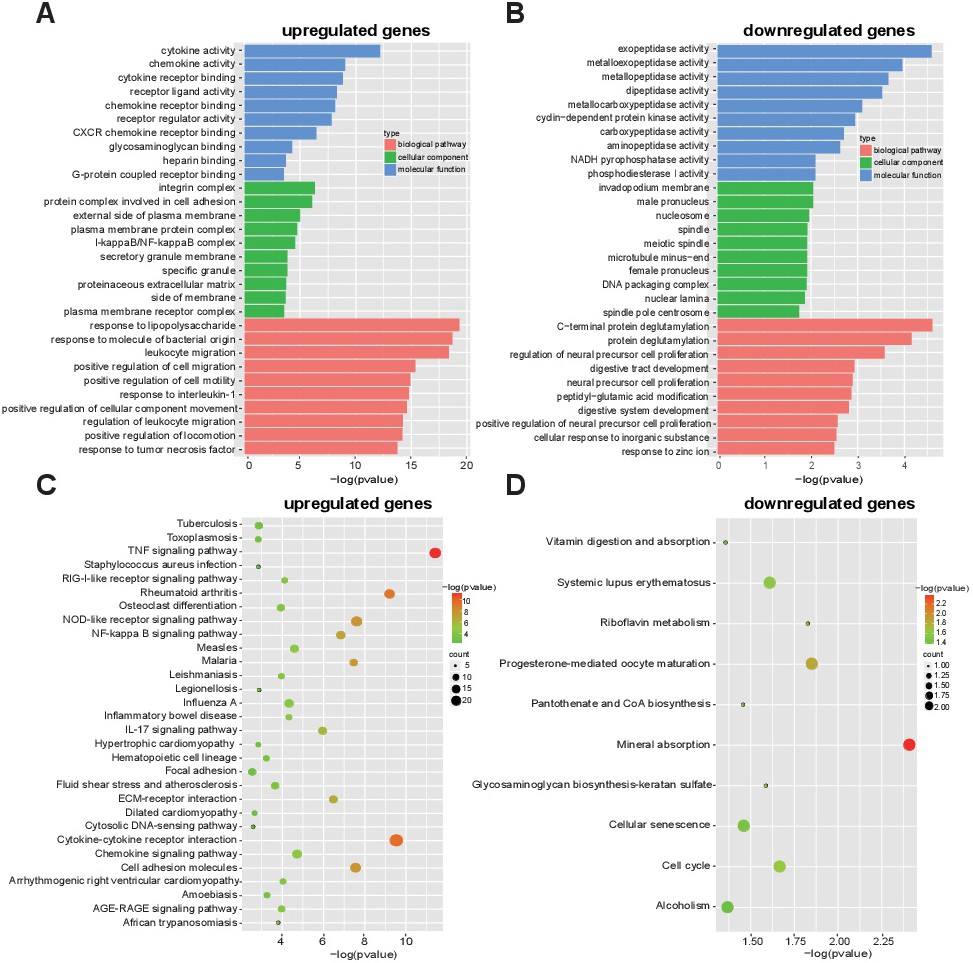
Fig. 2. GO and KEGG enrichment analyses for upregulated and downregulated mRNAs. GO enrichment analysis of upregulated (A) and downregulated (B) genes (Top 10, p<0.05). KEGG enrichment analysis for upregulated (C) and downregulated (D) genes (p<0.05). The red to green colors indicate high to low -log (p value) levels. Point size indicates the number of differentially expressed genes in the corresponding pathway.